Connecting Excel to live Power BI data sets
8 September 2023Combining Excel and Power BI
Although Power BI provides great flexibility and ease of reporting, Excel, launched in the 1980s, remains a powerful and often-used tool for analysis. Luckily, both tools are Microsoft products that can be combined with just a few clicks.
There are multiple ways to achieve this:
- We can start in the Power BI service (Online) environment.
- We can start with a (blank) Excel file.
Connecting Excel to live Power BI data sets
1. Starting Point: Power BI Service
Start by navigating to a published Power BI report in the Power BI Service environment.
1.1. Analyze in Excel
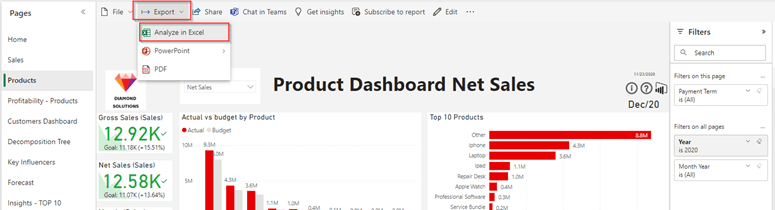
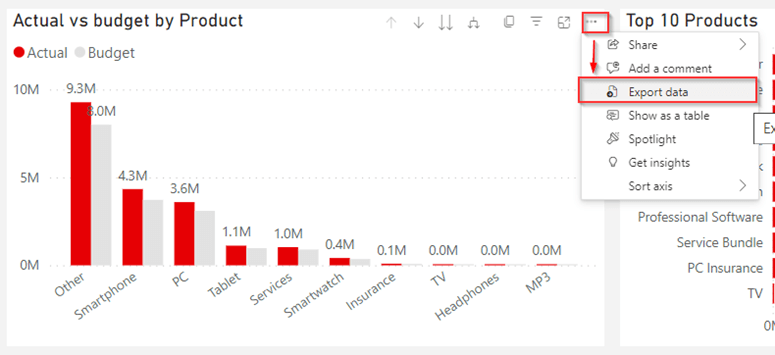
In a Power BI report, you can use the Export functionality, which you can find at the top of the page.
By selecting Export -> Analyze in Excel:
- A file will be downloaded, and you can open the downloaded file.
- Or another tab will be opened in your browser. Here you can select to open the file in Excel.
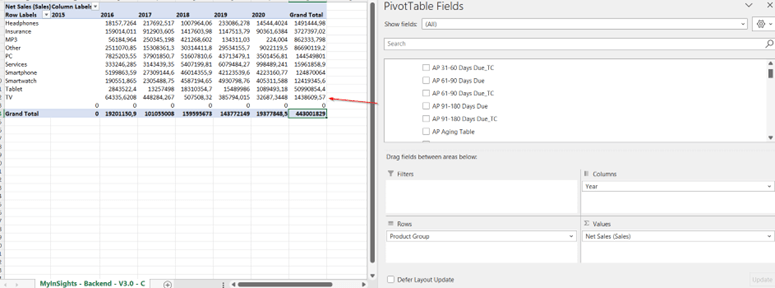
What you will see is a Pivot table, directly linked to the dataset, and you can start dragging and dropping the required fields to build your Excel reporting.
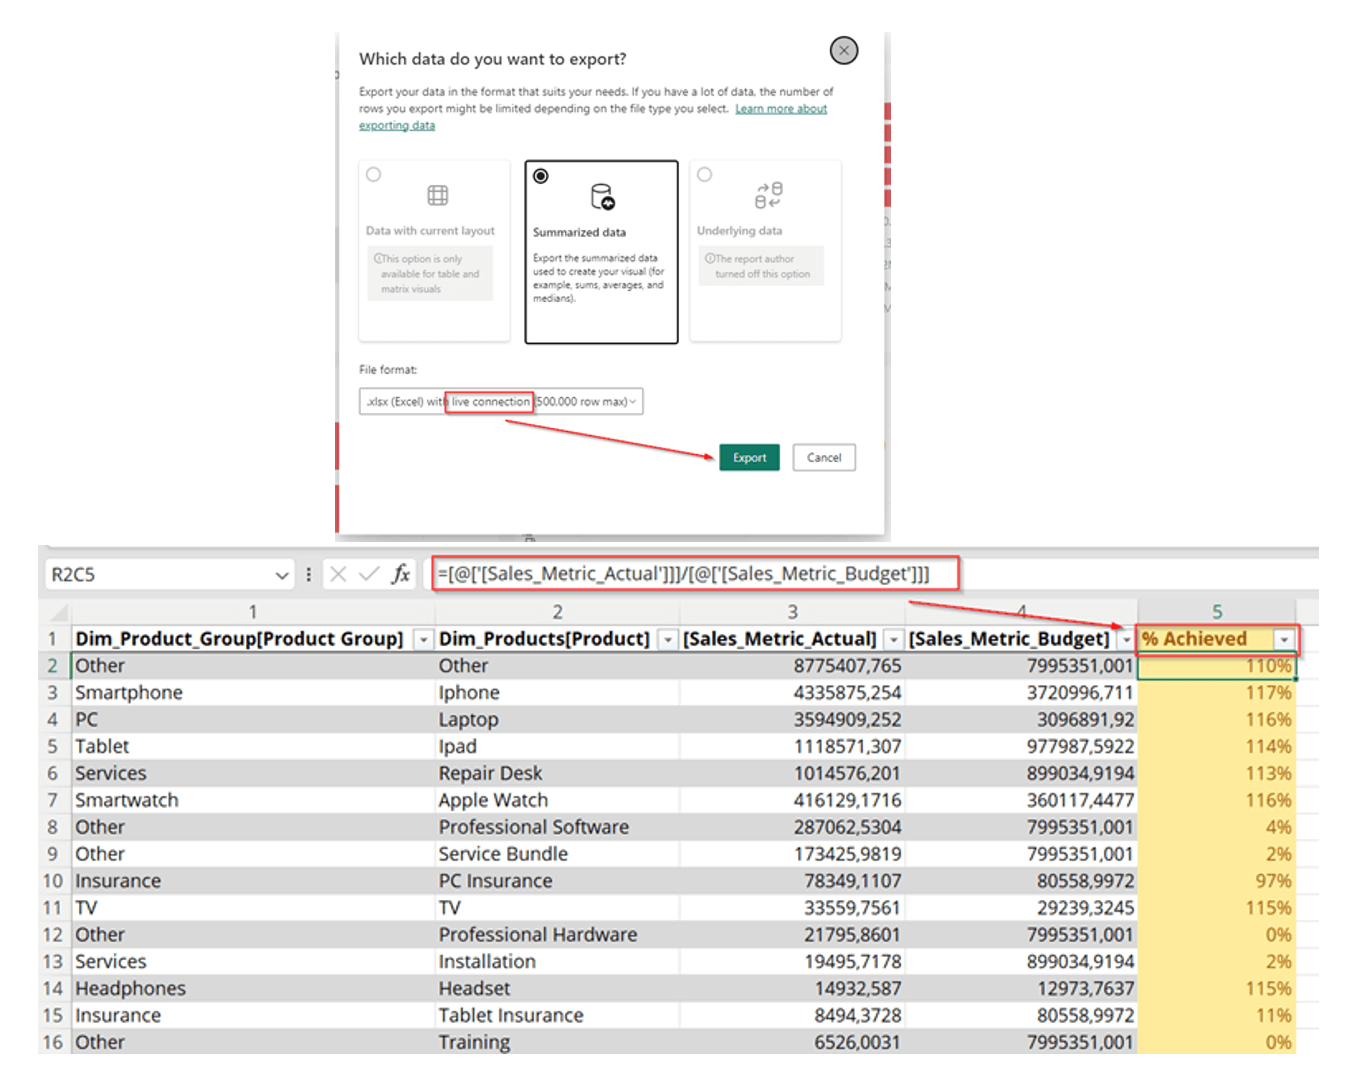
1.2. Export table with live connection
You can also download summarized data from a visual, with a live connection, to Excel. Thiswill be a refreshable table that can be enriched with Excel formulas. In the example below, we have exported some product information comparing actuals to budget, removed some columns, and added an Excel formula where we calculate the percentage achieved. This Excel file can be saved and refreshed at any time.
2. Starting Point: Power BI Service
Start by navigating to a published Power BI report in the Power BI Service environment.
2.1. Analyze in Excel
In a Power BI report, you can use the Export functionality, which you can find at the top of the page.
By selecting Export -> Analyze in Excel:
- A file will be downloaded, and you can open the downloaded file.
- Or another tab will be opened in your browser. Here, you can select to open the file in Excel.
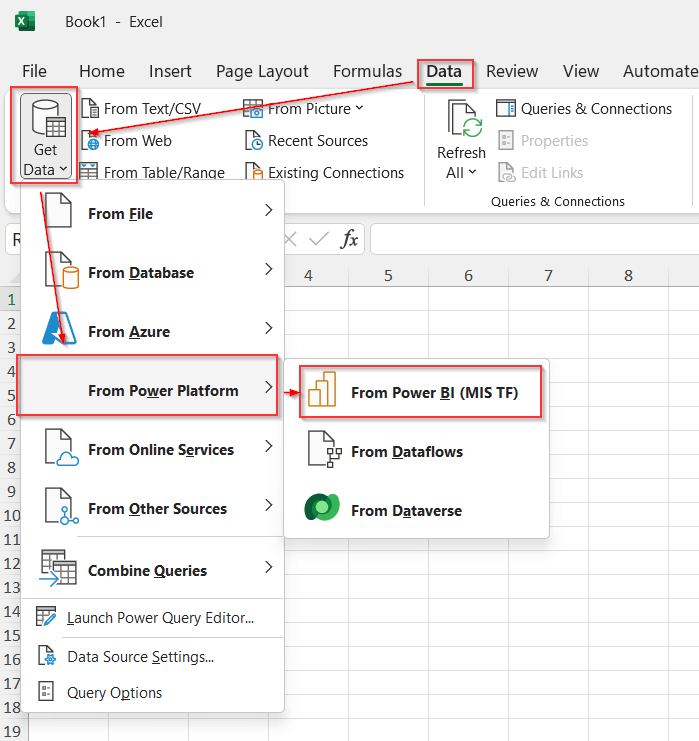
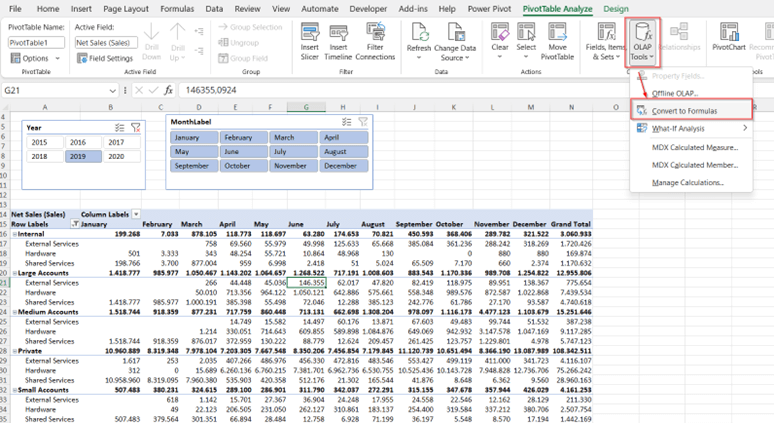
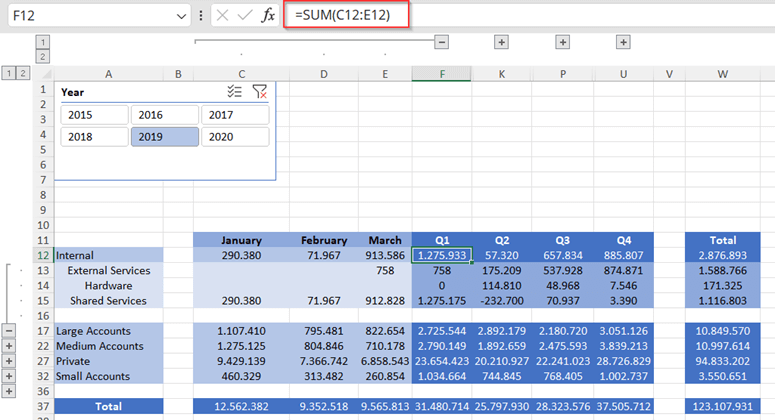
In Excel, it is worth mentioning that you can combine the flexibility of the tool with your live dataset. In this case, we need to use cube formulas. You’ll need to convert your table into formulas. Once converted, you will have the freedom to create a report with a certain layout. Below, you can see a dynamic report where Excel formulas and cube formulas are combined.
First of all, it’s best practice to start with a pivot table and convert this table using the convertto formula’s option.