A pragmatic approach to data governance. Takeaways TriFinance and dScribe breakfast session
28 June 20241. How to create an effective reporting culture through BI governance?
On Monday, May 28, TriFinance and data documentation solution dScribe organized a breakfast session on BI governance. TriFinance Data & Analytics Project Manager Evert Augustyns and dScribe founder and CEO Pieter Delaere demonstrated how companies can strengthen their reporting culture through improved data governance.
Evert Augustyns and Pieter Delaere explored pragmatic ways to elevate an organization’s data maturity to enhance the effectiveness of its reporting culture. They showed how well-defined KPIs and thoroughly documented reports can enhance KPI adoption and increase user engagement.
The session included an extensive testimonial from Lieven Tack, Business Controlling Manager at Fiberklaar, detailing how his company leverages Power BI and the dScribe data documentation solution to streamline and optimize their reporting processes.
All three speakers emphasized the crucial role of robust BI governance in creating an effective reporting culture within organizations.
2. How to identify the need for BI governance?
Organizations need BI governance to make sure that their BI processes are well structured, reliable, and efficient. Without proper governance, BI environments can become chaotic, characterized by a "spaghetti" of assets that lack organization and clarity.
The first thing you need to do on the path to an effective reporting culture, however, is to check if there is an existing need for BI governance in your organization. TriFinance’s Evert Augustyns explained that organizations can detect the need for BI Governance by asking the following key questions:
- How is your BI organization set up? Is there a centralized team or does everyone work on their own initiative?
- Who is responsible for BI in the organization?
- What level of BI support is provided by IT?
- Which tools are used for reporting besides Excel?
- Is there confidence in the quality of current reports?
- How many reports are available and how many are effectively used?
- Is the right knowledge present in the organization to meet the reporting needs?
Additionally, look for the following signs:
- There is no organization-wide vision and approach for BI
- Different versions of the truth circulate
- A data warehouse is available but the business is still creating their own reports
- There is a proliferation of Power BI datasets and reports
- Many individual reporting initiatives are being taken
- There are no aligned KPIs (definitions)
- There are no clear reporting templates and guidelines
- There is no clear implementation process (Dev - Test - PRD)
Reports often appear to exist in different organizational silos. Participants said that their organizations struggled with process complexity, different systems not communicating, leading to non-consolidated reporting. One participant mentioned KPIs often having different definitions depending on the users, different versions of the truth. Another participant was overflowed with business requests originating from different parts of the organization but having only minor differences.
3. Effective BI governance with an Analytics Operating Model
Providing structure and transparency, solid BI governance results in organizations establishing clear definitions and consistent data usage. It ensures that reporting is based on a single source of truth filled with high-quality data, which is essential for making informed business decisions.
‘Effective governance avoids duplicated efforts by stimulating clear communication and collaboration, reducing the risk of multiple versions of reports and datasets,’ Evert Augustyns says. ‘It helps in aligning KPIs, creating standard reporting templates, and establishing guidelines and implementation processes (Dev – Test – PRD).’
Ultimately, BI governance brings a company’s BI organization to a higher level allowing the business to steer on relevant insights that set the right priorities, thus driving better performance and strategic outcomes.
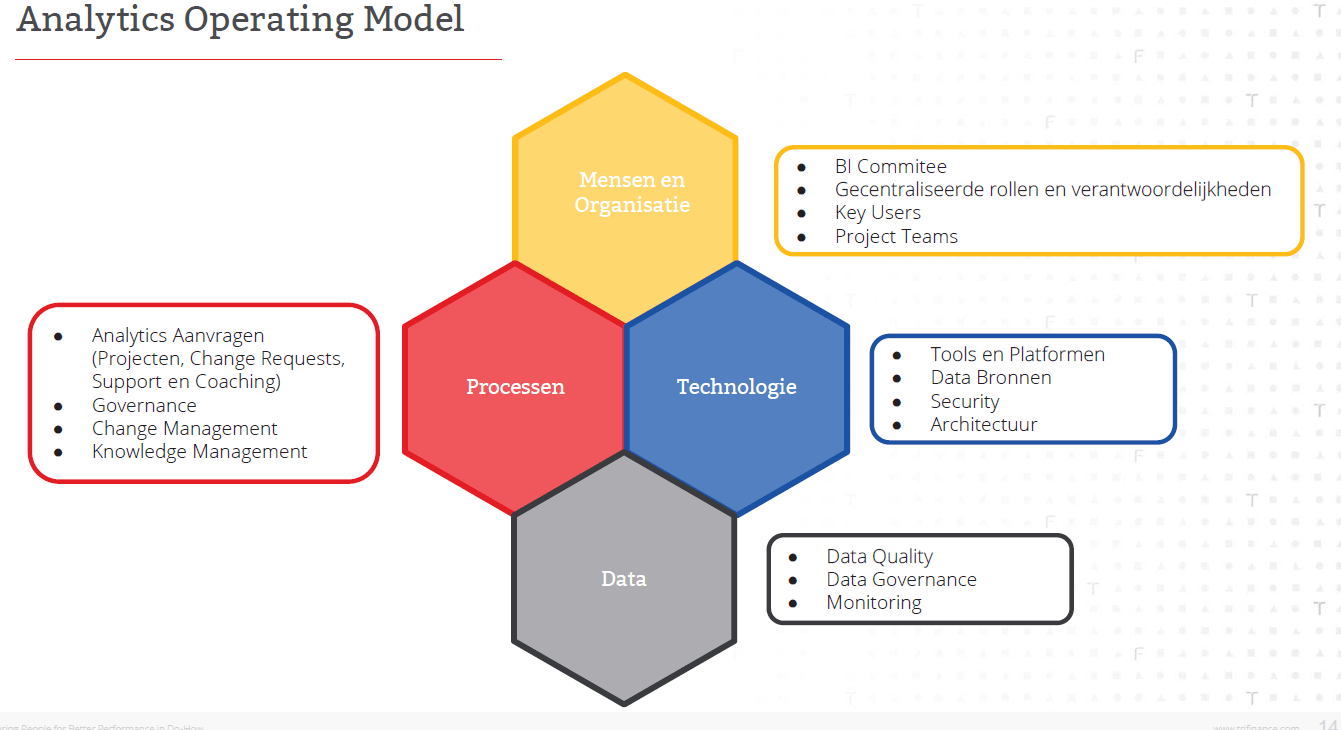
4. TriFinance Analytics Operating Model
The need for an Analytics Operating Model arises from the necessity to manage and streamline various aspects of business intelligence effectively.
People and Organization: A key element is the presence of a BI Committee, a body that sets the outlines for the coming years. Not just IT and the business should be represented, but all people involved in reporting inside the company who have ownership in certain decisions. This committee defines centralized roles and ensures ownership in decisions. Evert Augustyns highlights the importance of a "Center of Excellence" with field expertise to guarantee quality and support local key users. The central team handles group-wide reporting and ensures that local key users who create their own reports receive adequate support. Involving key users promotes adoption and frequent use of reports.
Technology: Effective reporting requires the right tools. Augustyns emphasizes choosing one or two primary tools to maintain focus. To avoid security breaches, it is important to make the right data sources accessible to the right people to make sure those people can see the data that they're allowed. A robust data architecture must facilitate seamless data access for reporting.
Data: Data quality and governance are vital, with an emphasis on data cleaning. Monitoring report usage and tracking refreshes help organizations to assess if their reporting has been successful. It is also useful to identify issues. Beyond Microsoft's standard reporting, custom dashboards provide comprehensive reporting capabilities.
Processes: In the data governance model, this component unifies the other three parts. Clearly defined analytics requests, project management, and change request processes are crucial: how are change requests capped? Who decides which requests can be worked on? Support and coaching are important, as is knowledge management. Organizations should make sure that knowledge is secured, especially with Power BI's monthly updates. Continuous investment in knowledge management ensures organizational growth through ongoing training.
Proper governance is essential for enhancing BI organization and reporting. It is an ongoing process requiring a balanced approach for sustained success.
5. dScribe: Enhancing data insights through streamlined documentation practices.
dScribe was founded in 2021 to address common challenges around data adoption and BI they observed in many companies, regardless of their sector or size. In most companies, there appears to be a core group of people proficient with data. These individuals can explain the reports they have, identify key data sources, and describe how their KPIs are structured. The rest of the organization, however, often seems to lack this understanding.
Many organizations claim to be data-driven, but their employees often lack a comprehensive understanding of the data or struggle to handle the reporting made available to them. The cause of that issue, according to dScribe CEO Pieter Delaere, is in many cases documentation.
‘Documentation is often inconsistent,’ he says. ‘It is scattered across Excel, Word, Confluence, and within reports themselves. This fragmented documentation is hard to locate, leading to confusion and reduced efficiency.’
Due to the inconsistency of documentation, data experts and analysts spend significant time—up to one day per week—answering repetitive questions and documenting insights, while managers struggle to increase the adoption of BI tools due to these inconsistencies. ‘We use a broad definition for the “manager” category,’ Pieter Delaere says. ‘You could call them “data leaders” of any kind, though we most often talk to BI managers. They are frustrated because their BI is not used enough or not effectively enough. They lose a lot of time with people who do not understand the reporting of the BI principles and then start to do their own thing in Excel. They often have to deal with colleagues who don’t know what the most important reports are that are being used to generate impact and value.’
Obviously, that scenario most of the time results in inefficiencies. Experts waste time that could be better spent on more valuable tasks. Analysts lose 15 percent of their productivity searching for reports and redoing analyses. Knowledge workers spend up to 19 percent of their day looking for information, which hampers overall organizational efficiency.
dScribe offers a comprehensive solution to these challenges by centralizing documentation, providing a single hub where all documentation is interconnected and easily accessible. This ensures that documentation is available where it’s needed, facilitating better insights and usage.
6. A key insight for BI governance
‘Three years ago,’ Pieter Delaere says, ‘we created a portal with a simple search bar that allowed anybody within a company to access any report or dataset — a user-friendly data documentation solution. That concept works, but only if you have a dedicated management team or a core group of sponsors promoting it. It requires a top-down approach with strong commitment to change management.
‘Less than a year ago, we shifted to a bottom-up approach. Instead of training people because a portal was installed, we made sure that the portal became unavoidable. Users can click on diverse terms in a report to see the definitions. They can also see if something is undocumented, and remedy it.
‘A key insight for BI governance,’ Pieter Delaere concludes, ‘is to ensure information is integrated into people's workflow. The more you remove documentation and information from their flow, the harder you will have to work to maintain it.
7. The Fiberklaar reporting challenge
Fiberklaar is a joint venture of EQT and Proximus founded in 2020. The company that designs, builds and manages an open fiber network in Flanders, considers it their mission connect 1.5 million Flemish households to the fiber network. 'It is important for our economy that we have a good digital infrastructure,' says Fiberklaar Group Controller Lieven Tack. 'Fiber is the future. A large part of our economy depends on it and that will only increase in the future. Demand for data is growing rapidly, with fixed broadband accounting for 83 percent of all traffic.’
Remote working, entertainment, gaming, education and healthcare all necessitate the use of fiber. ‘Fiber also promotes innovation and a greener society,’ Lieven Tack says. ‘It stimulates efficient working practices, economic growth and social inclusion’.
When Fiberklaar first launched in 2021, over one hundred people had to start collaborating. One person set up reporting to unlock data from various systems, such as construction, commercial activities, operations, and financials. Reporting was set up for each of those domains, with data models for each silo.
Data disclosure went reasonably well. But users often encountered the same concepts and terms in different reports, and certain concepts or things were given different names. Managing data across construction, operations, and financials for one and a half million addresses proved impossible.
Reporting was IT-driven rather than business-driven, causing uncertainty about report and data quality. The organization relied heavily on Excel-based tracking, and planning was fragmented. There was a need for aligned reporting definitions and processes, with limited governance over reports. To address these issues, Fiberklaar teamed up with TriFinance in 2022 to improve their reporting journey. You can read all about it in our Fiberklaar client story.
To address these issues, Fiberklaar identified the need for Power BI reporting. The first step was to understand the business's reporting needs, focusing on definitions and processes. Next, a roadmap for reporting was developed, outlining the desired reporting architecture, high-level reporting data model design, and a project plan and budget. The new reporting environment was then implemented in Azure and Power BI. Key users and end users were trained and coached to maintain and expand the reports independently.
After implementation, the architecture included Power BI Dataflows, an Azure SQL Database for staging, automated data refresh and security, a reporting portal with dashboards and reports, and Azure Data Lake Storage and Azure Data Factory for data integration and management.
8. 100 different definitions - with monthly additions
Governance involved a structured approach where different stakeholders, including developers, key users, and end users, managed and developed datasets and reports collaboratively. Data quality and governance were jointly managed by TriFinance and Fiberklaar.
The need for dScribe arose from the existence of over 100 different definitions, with monthly additions due to the dynamic context. Power BI offered limited capabilities to display and maintain definitions per report, underscoring the necessity for dScribe to manage these complexities effectively. dScribe ensures streamlined documentation, making it easier to access relevant information and maintain consistency across reports. This now addresses Fiberklaar’s challenges by providing a centralized hub for documentation, enhancing data quality, and supporting the continuous evolution of reporting definitions and processes.
Read more
- Read and download the TriFinance client story on Fiberklaar: 'Fiberklaar rapporteert tegen glasvezelsnelheid'
- Read the press release on the TriFinance - dScribe partnership: TriFinance enters partnership with innovative Belgian data knowledge provider dScribe
- Read more on the TriFinance - dScribe partnership: TriFinance enters partnership with innovative Belgian Data knowledge provider dScribe